
[ad_1]
angel_nt
A guest post by Ovi
Below are a number of Crude plus Condensate (C + C) production charts, usually shortened to “oil”, for oil-producing countries. The charts are created from data provided by the EIA’s International Energy Statistics and are updated to November 2023. This is the latest and most detailed/complete World Oil production information available. Information from other sources such as OPEC, the STEO and country-specific sites such as Brazil, Norway, and China is used to provide a short-term outlook.
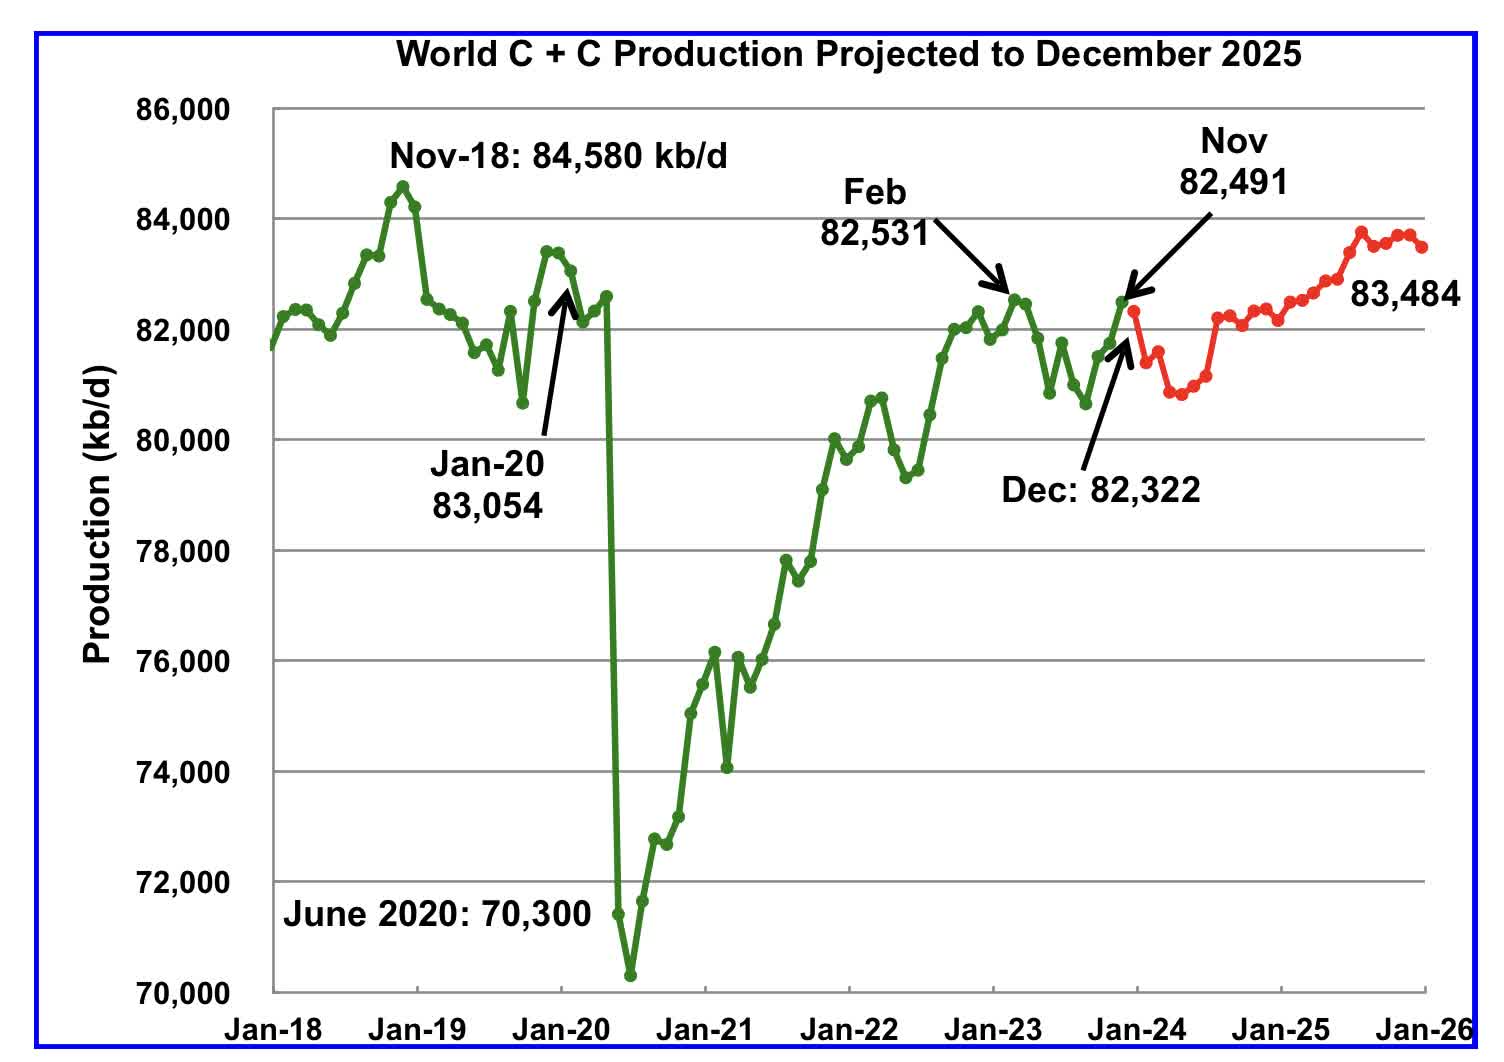
World oil production increased by 745 kb/d in November, green graph. The largest increase came from Canada, adding 360 kb/d. December World production is projected to drop by 169 kb/d to 82,232 kb/d.
This chart also projects World C + C production out to December 2025. It uses the March 2024 STEO report along with the International Energy Statistics to make the projection. (Red markers).
The red graph forecasts that World crude production in December 2025 will be 83,484 kb/d and is 1,096 kb/d lower than the November 2018 peak.
From December 2023 to December 2025, production is estimated to increase by 1,162 kb/d. Part of the big drop projected for January 2024 is associated with the drop in US January production due to bad weather in the central US.
OPEC is projecting close to a 1,500 kb/d increase in demand from Q4-23 to Q3-24. Looking at the chart, supply in Q4-23 is not that different than Q3-24. This implies that the supply/demand outlook should continue to tighten going into the second and third quarters. Keep in mind that OPEC+ has close to 3,000 kb/d of production cuts in reserve if required by slowly increasing demand.
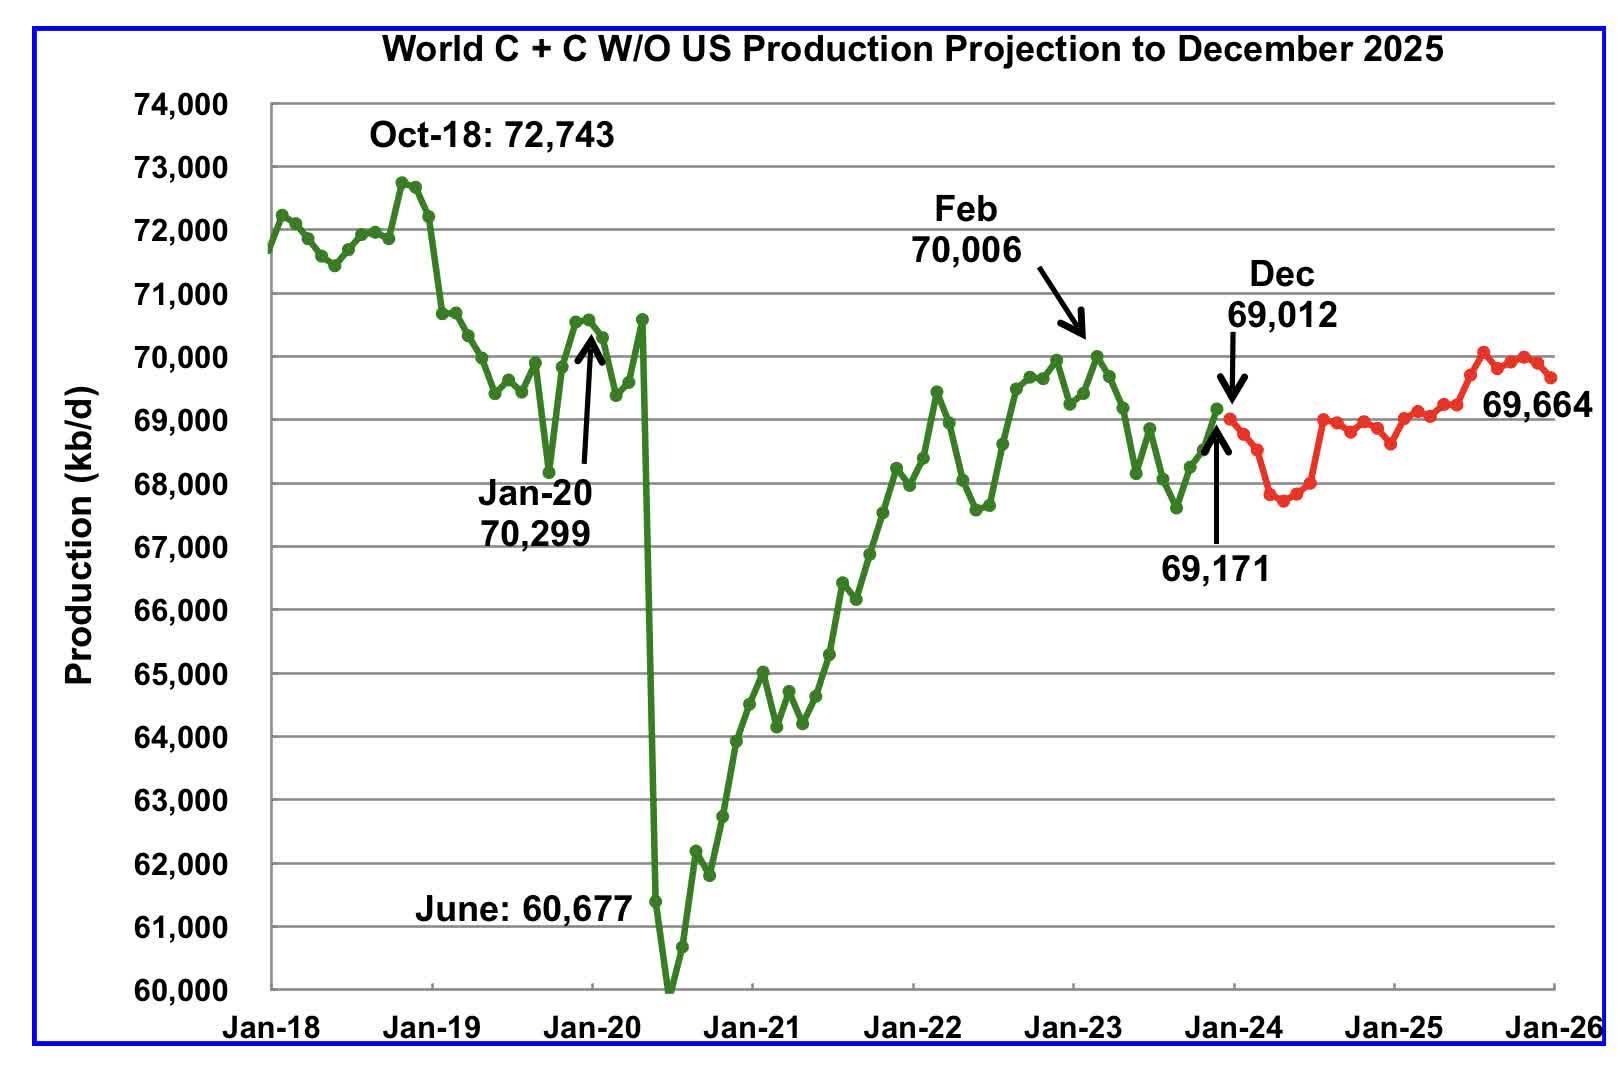
World without US November oil output increased by 645 kb/d to 69,171 kb/d. December production is expected to drop to 69,012 kb/d.
Note that December 2025 output of 69,664 kb/d is lower than February 2023. Is this an early indicator that World without US oil production is heading into a plateau phase?
World oil production W/O the U.S. from December 2023 to December 2025 is forecast to increase by a total of 652 kb/d.
A Different Perspective on World Oil Production
Instead of dividing the World oil-producing countries into OPEC countries and Non-OPEC countries, this section divides the countries into two groups on the basis of their production capacity. The division will be The Big Three, US, Saudi Arabia and Russia, and the Rest, i.e. the World oil producers W/O the Big 3. The top producer in the Rest, currently Canada, produces close to half of the lowest producer in the Big Three.
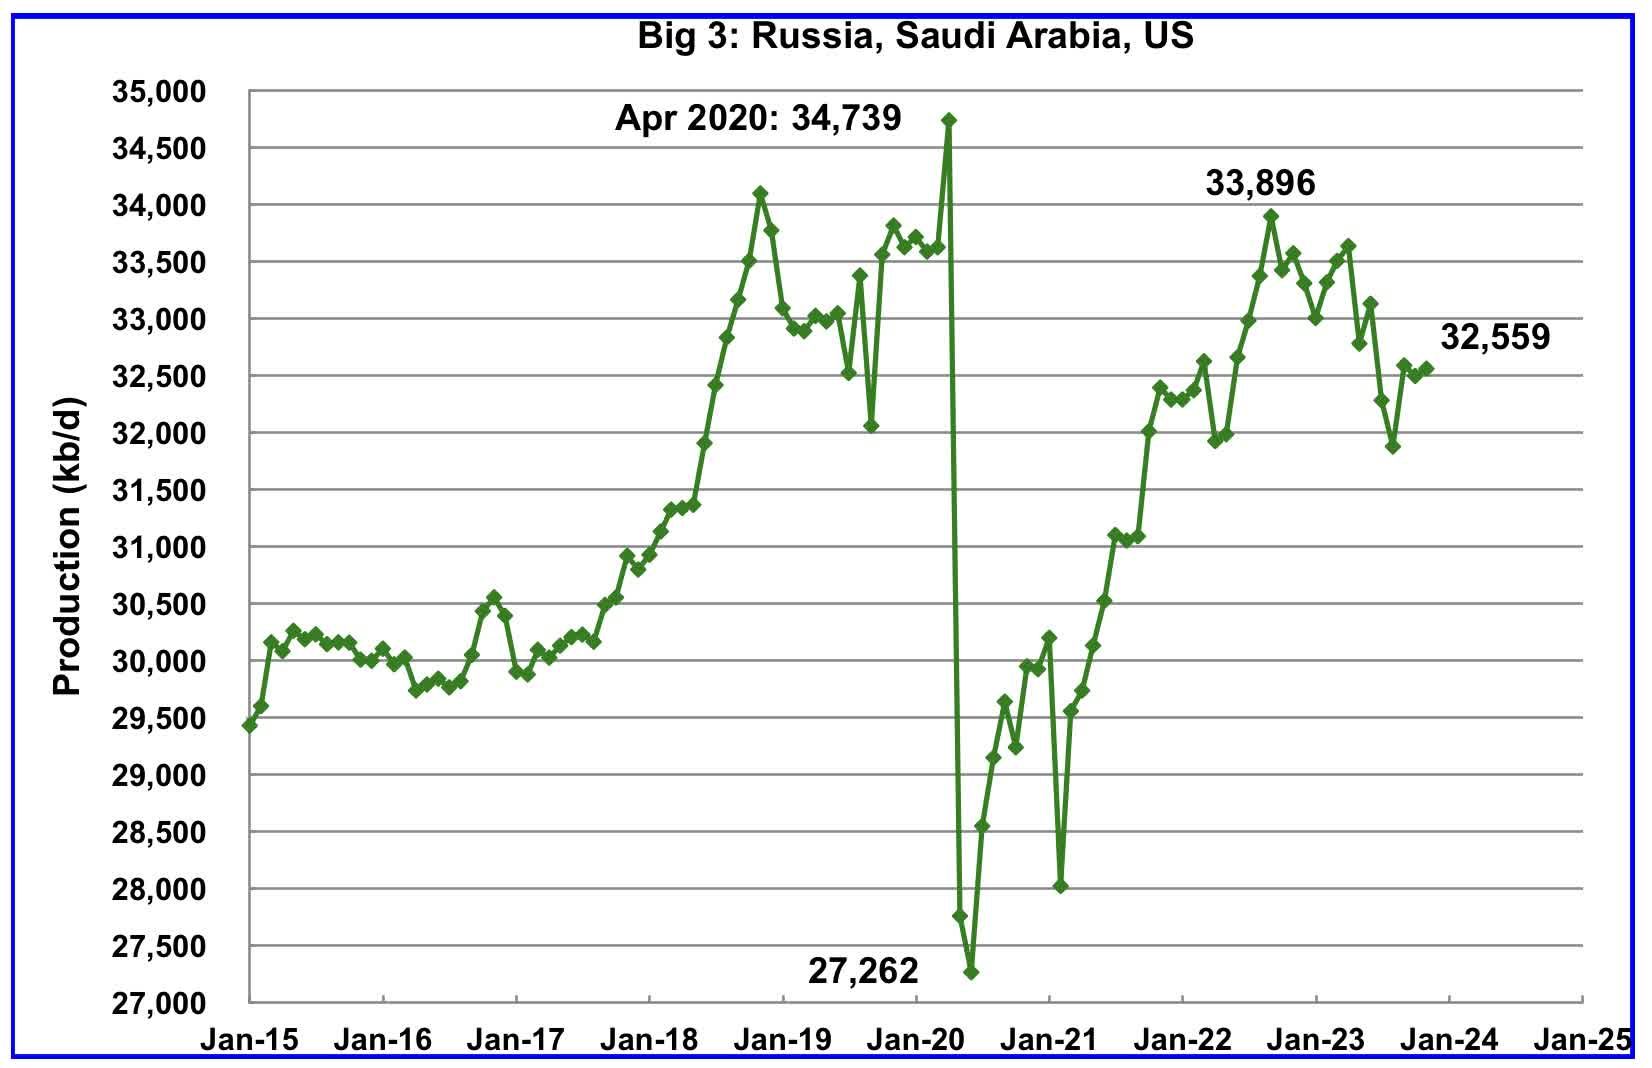
Peak production in the Big 3 occurred in April 2020 at a rate of 34,739 kb/d. The peak was associated with a large production increase from Saudi Arabia. Post covid, production peaked at 33,896 kb/d in September 2022. The production drop since then is due to cutbacks in Russia and Saudi Arabia.
November production from the Big 3 increased by 64 kb/d to 32,559 kb/d.
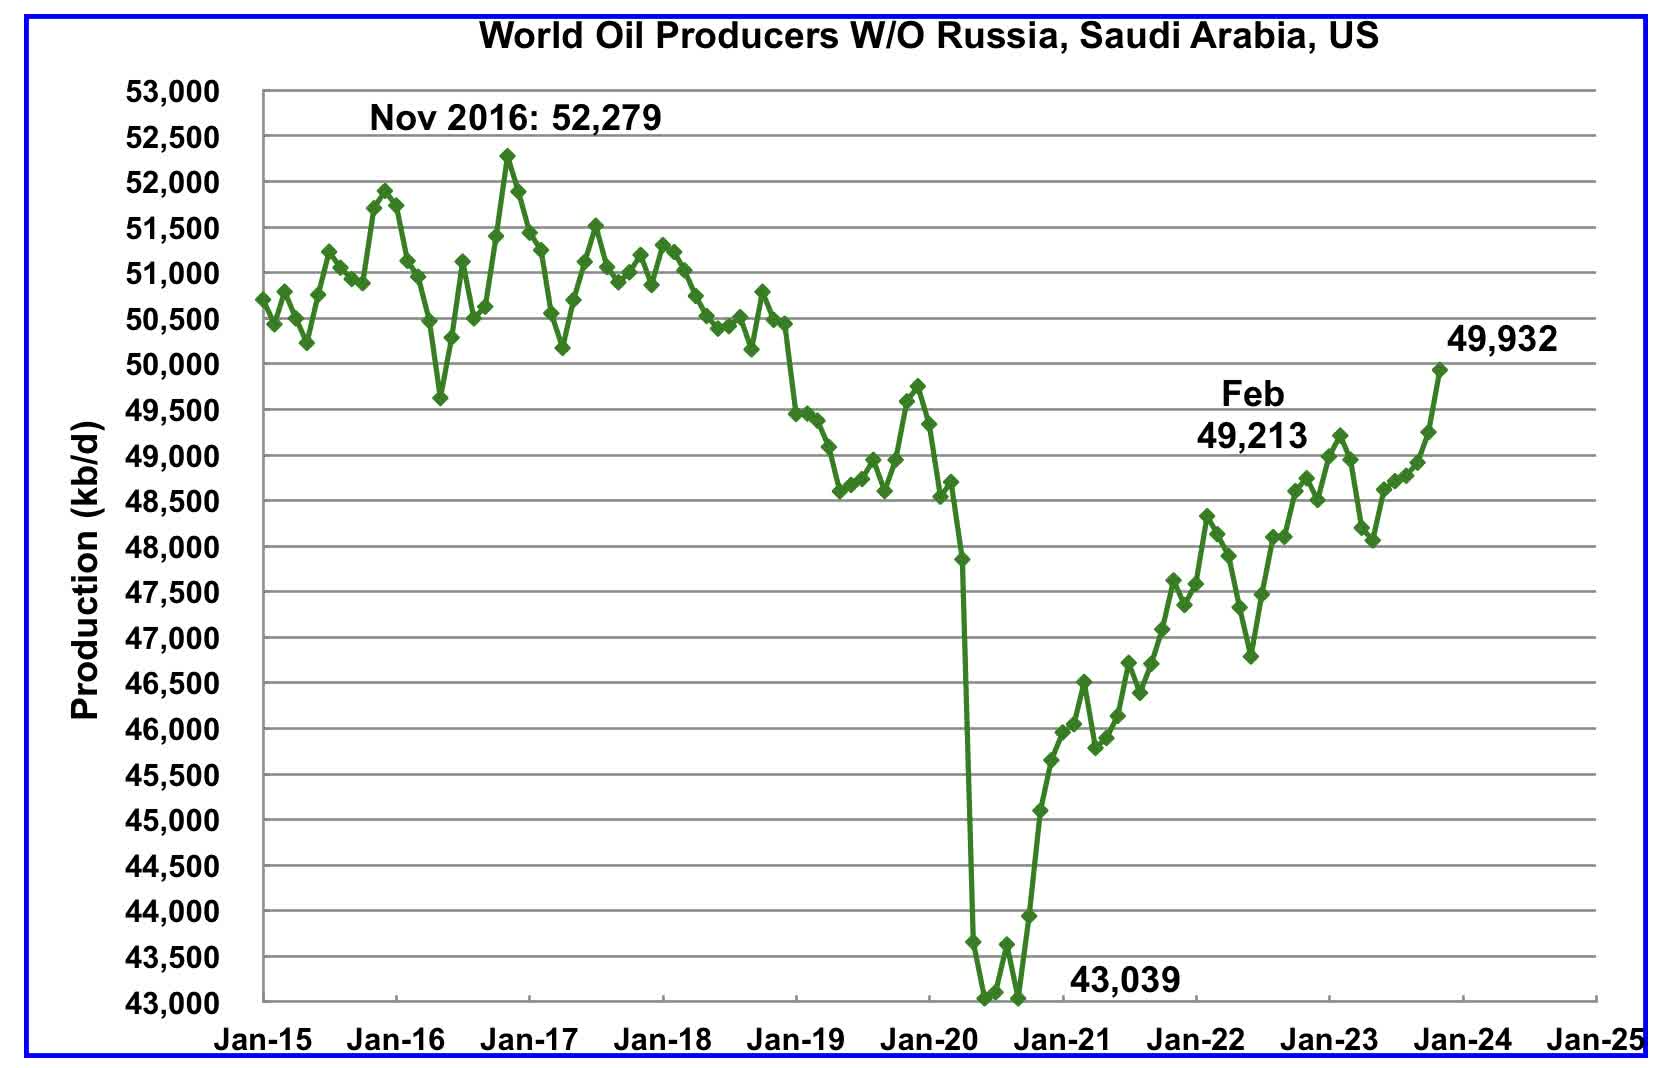
Production in the Rest has been slowly increasing since the low of September 2020 at 43,039 kb/d. In February 2023 production rose to a post covid high 49,213 kb/d. Output in November was 49,932 kb/d, an increase of 682 kb/d over October and exceeded the February 2023 high by 719 kb/d.
World Oil Countries Ranked by Production
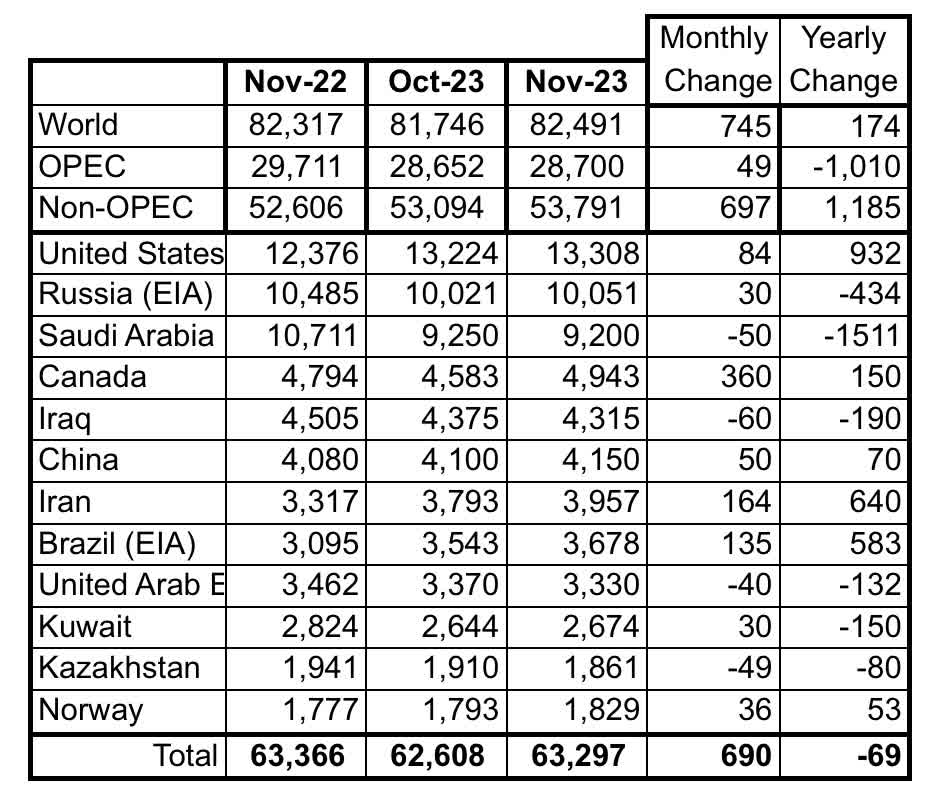
Above are listed the World’s 12 largest oil producers. In November 2023, these 12 countries produced 76.7% of the world’s oil. On a MoM basis, these 12 countries increased production by 690 kb/d while on a YOY basis, production dropped by 69 kb/d. On a YoY basis, note how the size of the Saudi Arabia production drop overshadows the US increase.
Projection for Non-OPEC Oil Production
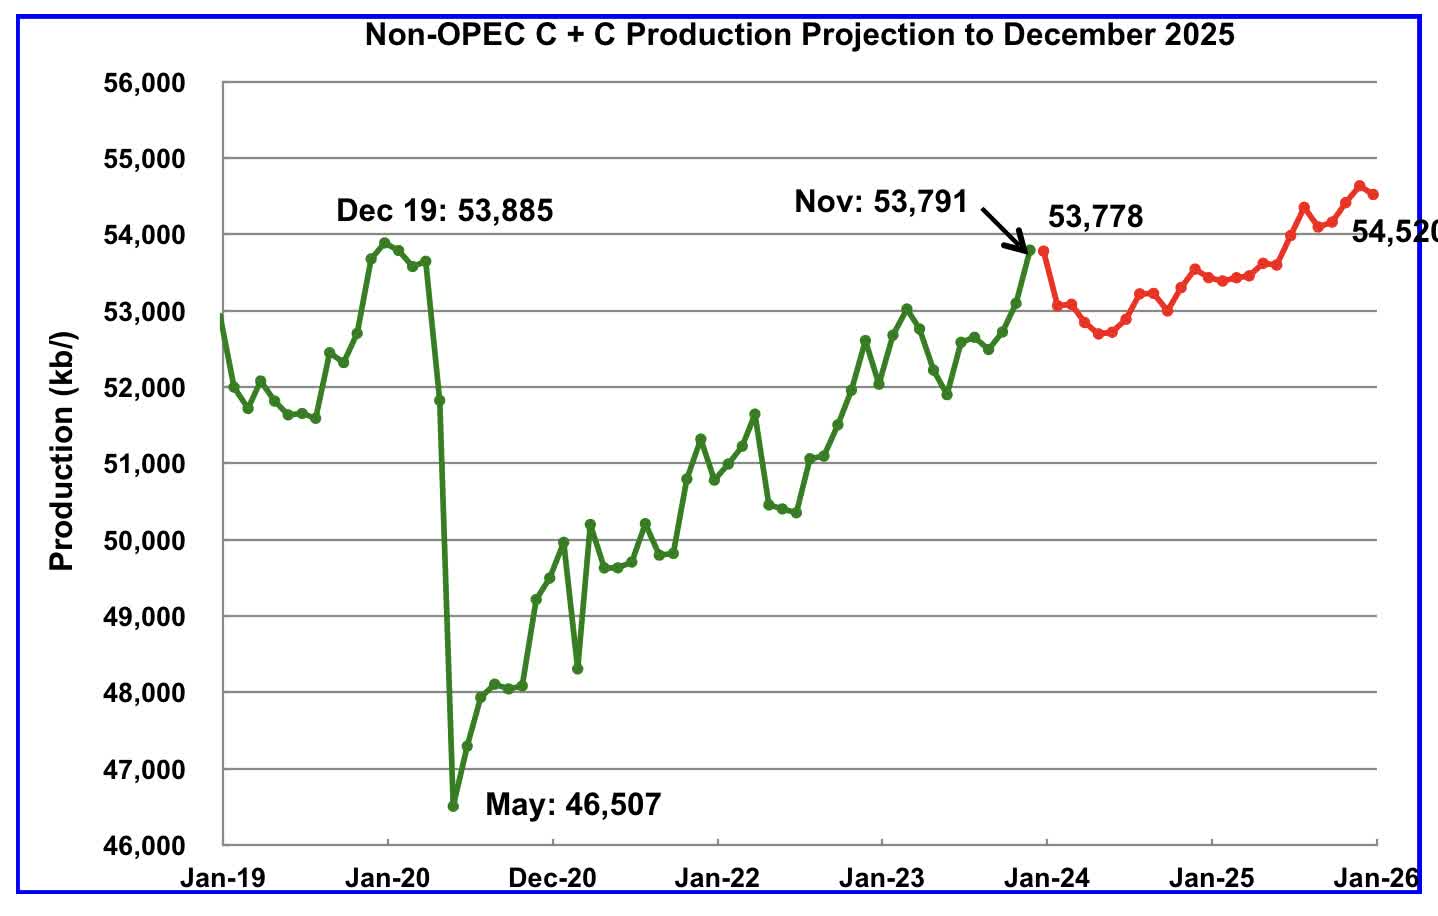
November Non-OPEC oil production rose by 697 kb/d to 53,791 kb/d. The largest increase came from Canada, 360 kb/d. Note that Non-OPEC production now includes Angola.
Using data from the March 2023 STEO, a projection for Non-OPEC oil output was made for the period December 2023 to December 2025. (Red graph). Output is expected to reach 54,520 kb/d in December 2025, which is 635 kb/d higher than the December 2019 peak of 53,885 kb/d.
From December 2023 to December 2025, oil production in Non-OPEC countries is expected to increase by 742 kb/d. According to the STEO, the major contributors to the increase are expected to be the US and Guyana.
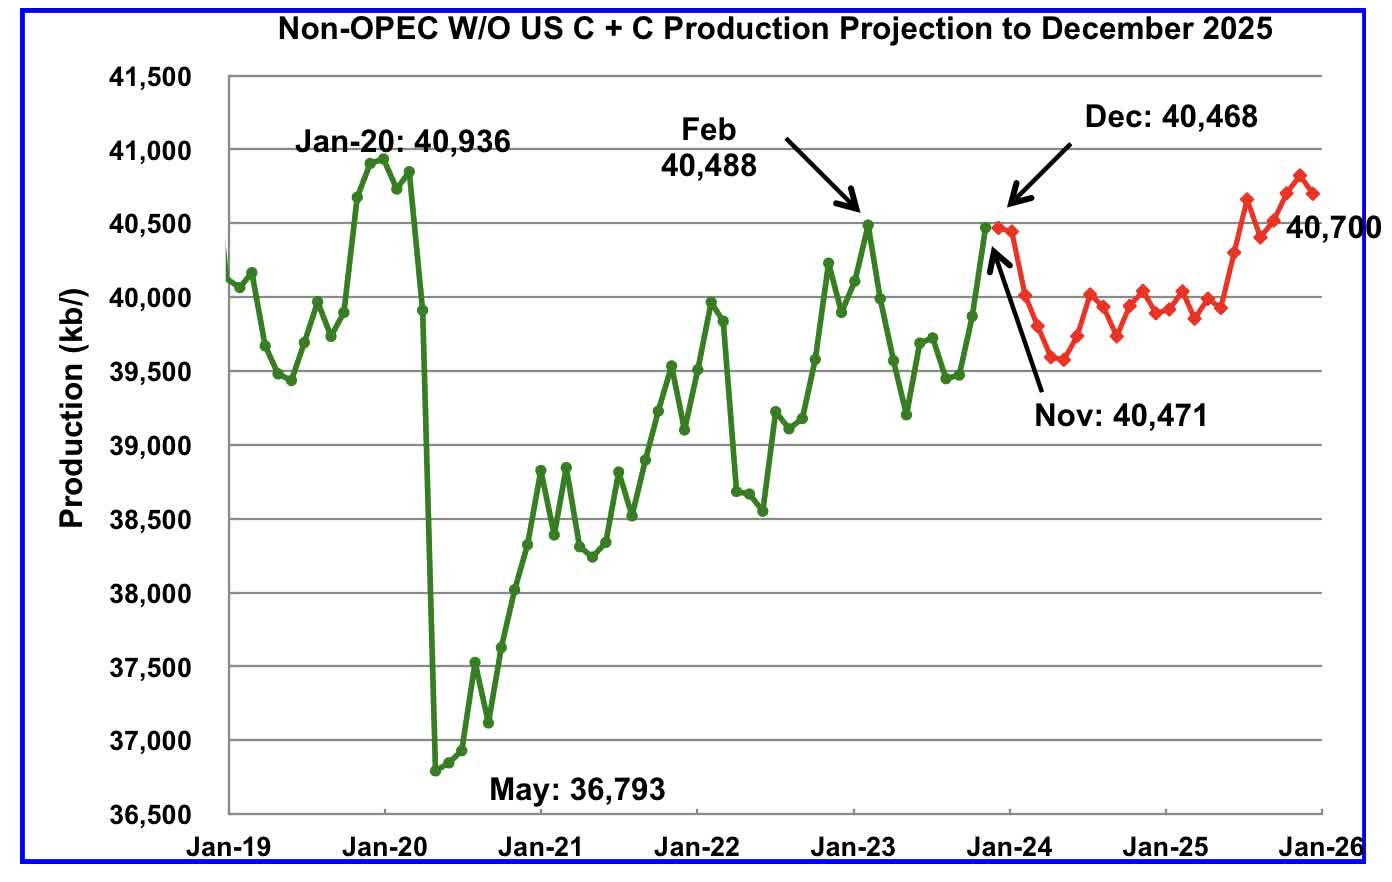
November Non-OPEC W/O US production increased by 601 kb/d to 40,471 kb/d. December production is projected to drop by 3 kb/d from November.
From December 2023 to December 2025, production in Non-OPEC countries W/O the US is expected to increase by 232 kb/d.
Note that December 2025 output is 212 kb/d higher than the February 2020 high of 40,468 kb/d. It is also 236 kb/d lower than the pre-pandemic high of January 2020, 40,936 kb/d.
Non-OPEC Oil Countries Ranked by Production
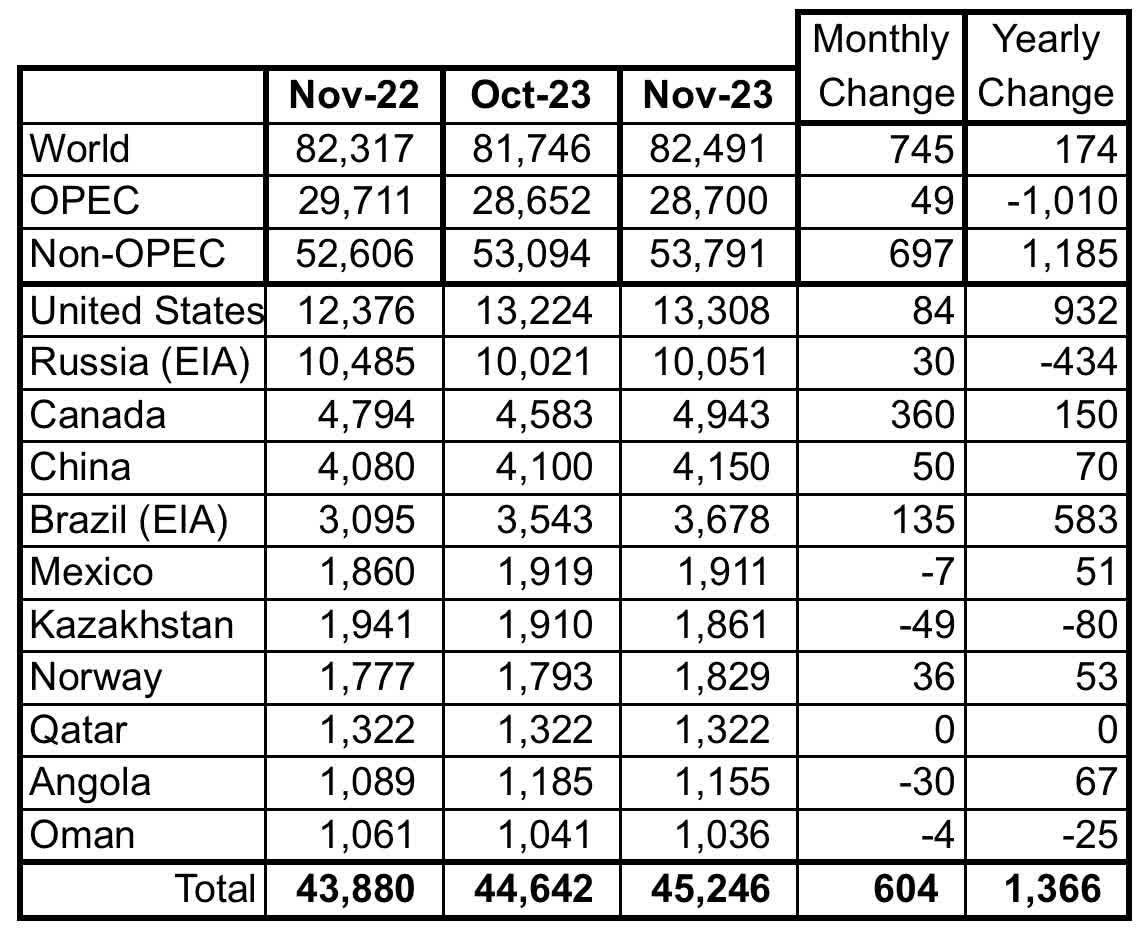
Listed above are the World’s 11 largest Non-OPEC producers. The criteria for inclusion in the table is that all of the countries produce more than 1,000 kb/d. Note that Angola has been added to this table.
November’s production increase for these eleven Non-OPEC countries was 604 kb/d while as a whole the Non-OPEC countries saw a production increase of 697 kb/d.
In November 2023, these 11 countries produced 84.1% of all Non-OPEC oil production.
OPEC’s C + C production increased by 49 kb/d MoM while YoY it decreased by 1,010 kb/d. World MoM production increased by 745 kb/d while YoY output increased by 174 kb/d.
Non-OPEC Oil Production Charts by Country
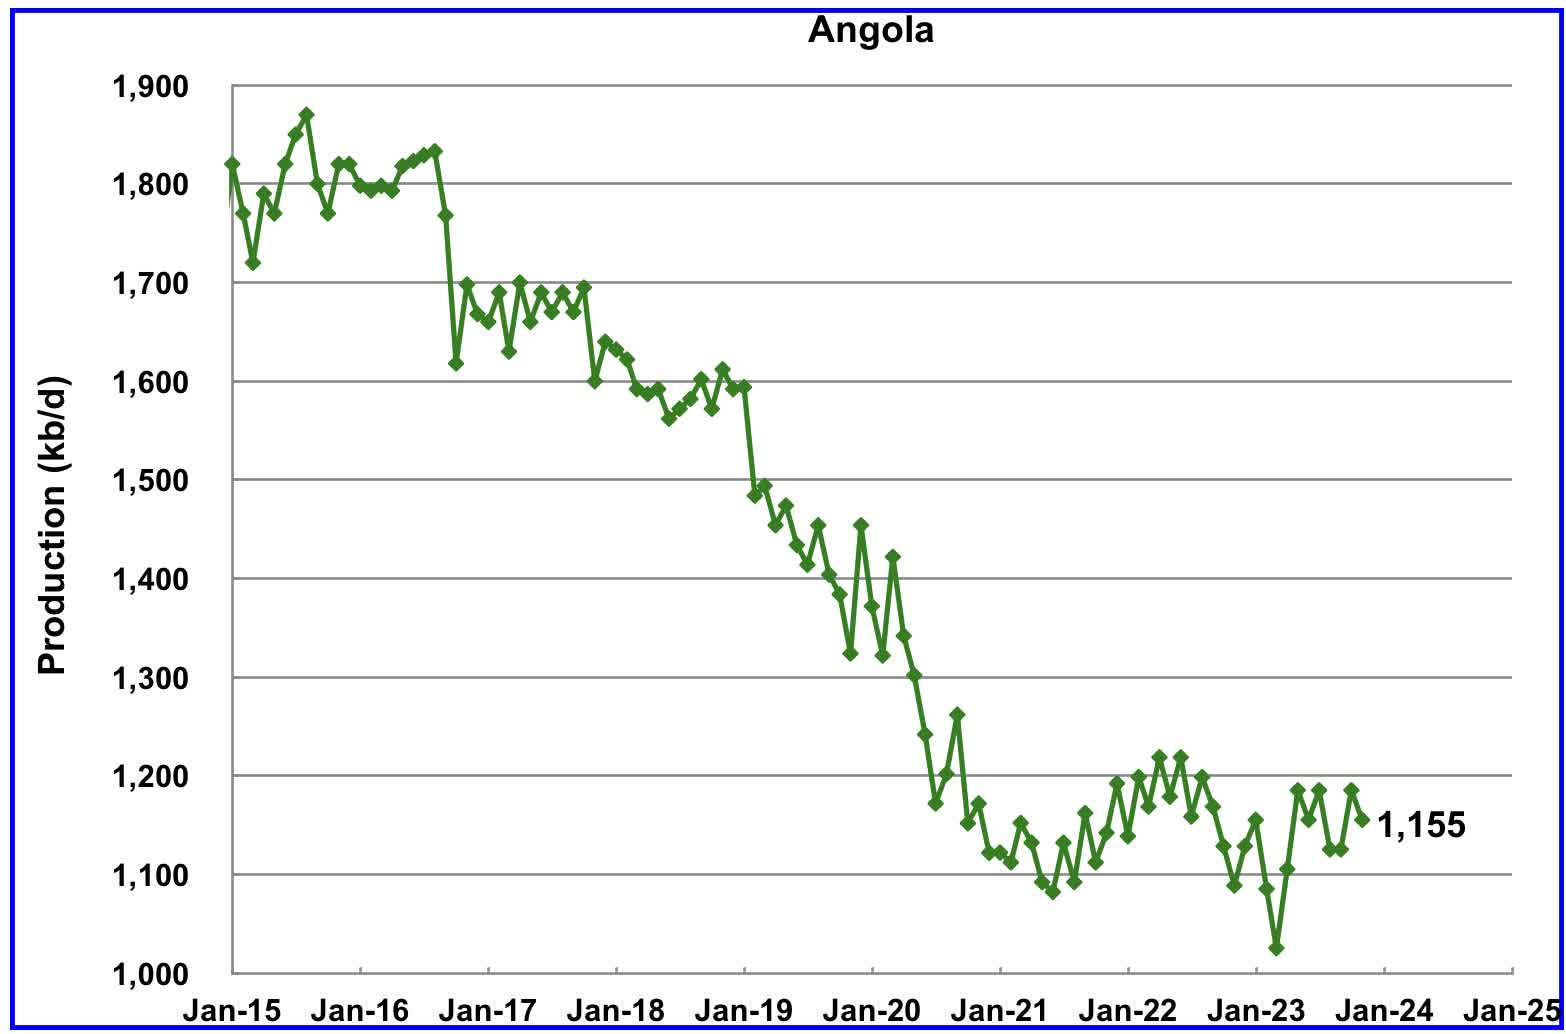
Angola has been added to the Non-OPEC producing countries since they have resigned from OPEC. Angola’s production stopped declining in mid-2021 and is attempting to grow by attracting foreign investors.
Angola’s November production decreased by 30 kb/d to 1,155 kb/d. Angola’s production since mid-2021 appears to have settled into a plateau phase in the 1,100 kb/d range.
According to this source: “Angola to maintain oil output at 1.1. million bpd through at least 2027“.
“Angola is producing about 1.1. million barrels per day of crude, similar to its level before it exited the Organization of the Petroleum Exporting Countries, and expects to maintain those volumes at least until 2027.“
Output at Africa’s second-largest crude oil exporter has declined steadily since hitting a peak of 2 million barrels per day (bpd) in 2008. It aims to produce more natural gas to counter part of the oil decline.”
According to this source: “The government, recent efforts to attract foreign investors should bear fruit in the coming months. Their appetite was already confirmed in September, when the ANPG granted two new operating licences for blocks that contain considerable oil reserves.
The oil sector will therefore return to growth in 2024. However, this growth is expected to remain limited. The sector is being penalised by both the natural decline in reserves and by ageing infrastructure, which requires new maintenance operations.”
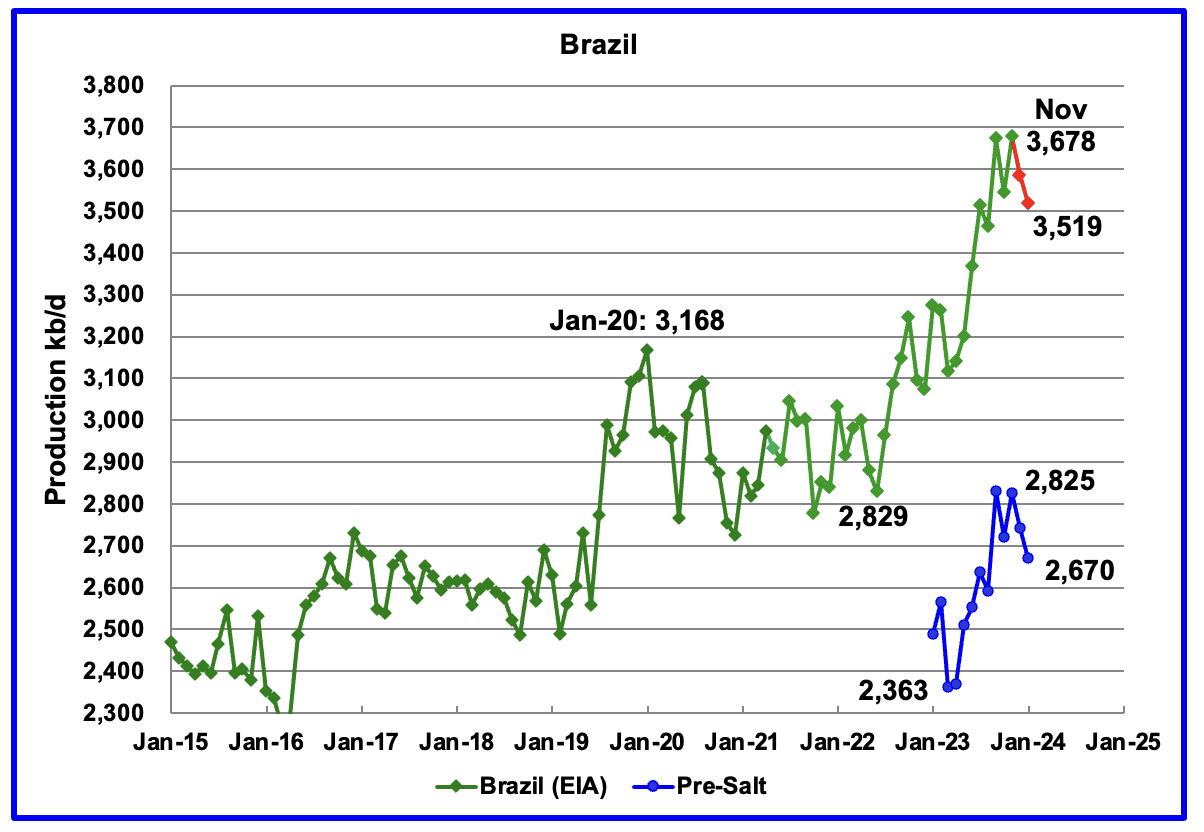
The EIA reported that Brazil’s November production increased by 135 kb/d to a new high of 3,678 kb/d.
Brazil’s National Petroleum Association (BNPA) reported that output dropped in both December and January to 3,519 kb/d. December production dropped by 93 kb/d to 3,585 kb/d.
From March 2023 to November 2023, production increased by 563 kb/d. A similar rise in production is not expected in 2024. For 2024 the MOMR is expecting a smaller increase, closer to 120 kb/d, while the EIA is forecasting flat output.
The March MOMR notes that: “Crude oil output is expected to increase through production ramp-ups in the Buzios (Franco), Mero (Libra NW), Tupi (Lula) and Itapu (Florim) fields. Oil project start-ups are expected at the Buzios, Atlanta, Pampo-Enchova Cluster and Vida sites. However, increasing costs in the offshore market and inflation might continue to delay projects and could temper growth in the short term
Production from Brazil’s offshore “pre-salt” region has been added to this chart. November oil production increased by 103 kb/d to 2,825 kb/d. January pre-salt production dropped to 2,670 kb/d.
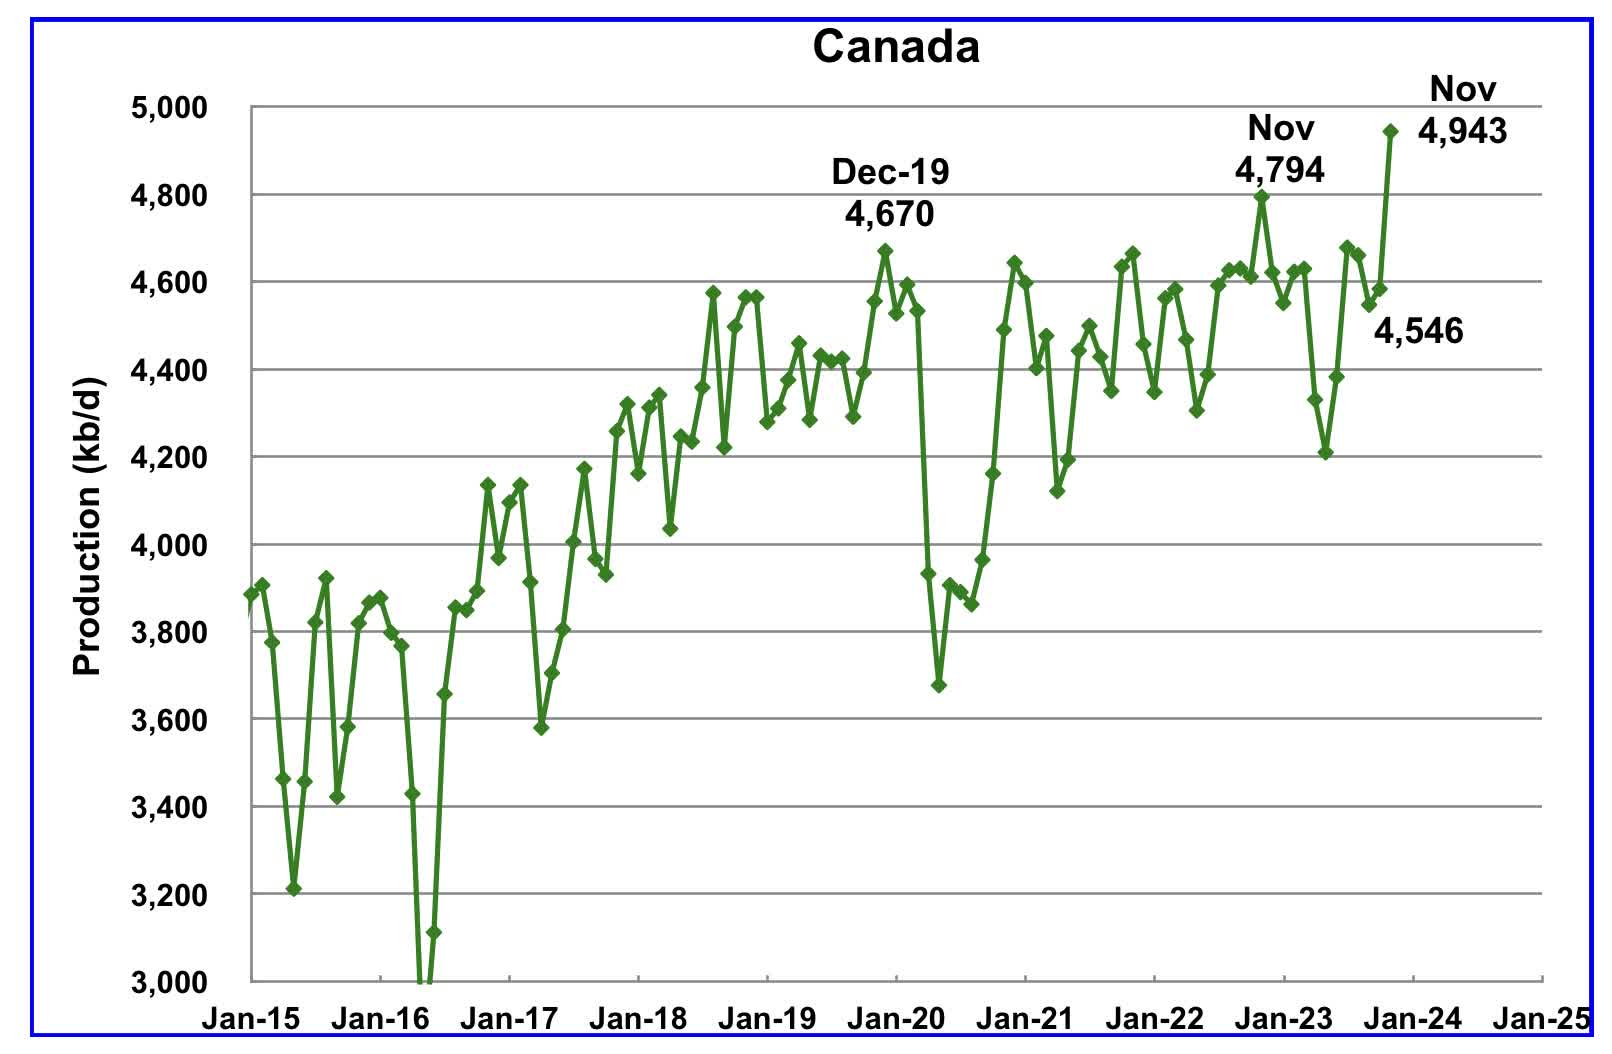
According to the EIA, Canada’s production increased by 360 kb/d in November to a record 4,943 kb/d.
In March 2024 the TMX pipeline suffered another delay when the pipeline could not be pulled through a tunnel.
On February 2024, according to TMX, the pipeline was successfully removed from the tunnel
“Trans Mountain has successfully removed the pipe from the original pullback.
Preparatory work for the new pullback is ongoing including coating and welding the pipe.”
Even though the pipeline is not complete, filling of the Trans Mountain oil pipeline has begun according to this article.
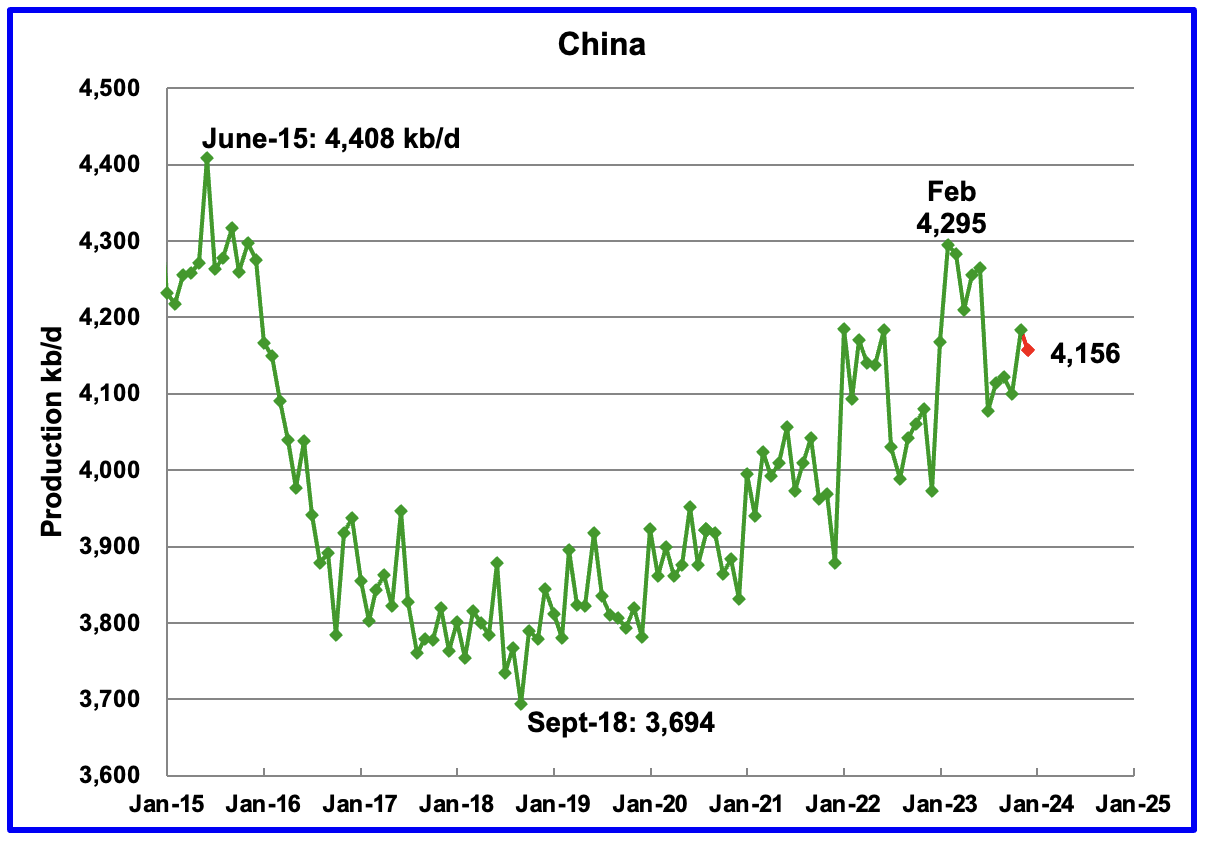
The EIA reported China’s oil output in November increased by 50 kb/d to 4,150 kb/d.
The China National Bureau of Statistics reported that output dropped in December by 24 kb/d to 4,156 kb/d. In late March 2024, The China Bureau announced the average production in January and February was 4,277 kb/d (Not shown). This is slightly lower than February high of 4,295 kb/d.
Every January for the last four years, China’s production has seen a massive increase. In 2022 production jumped by 322 kb/d from December 2021 to February 2022. However according to the March MOMR: For 2024, Chinese liquids production is expected to rise by about 10 tb/d. The EIA generally agrees since it is also projecting no growth for 2024.
While China’s production growth has risen steadily since 2018, it may be approaching its post-pandemic high as inferred by the March MOMR and the EIA reports.
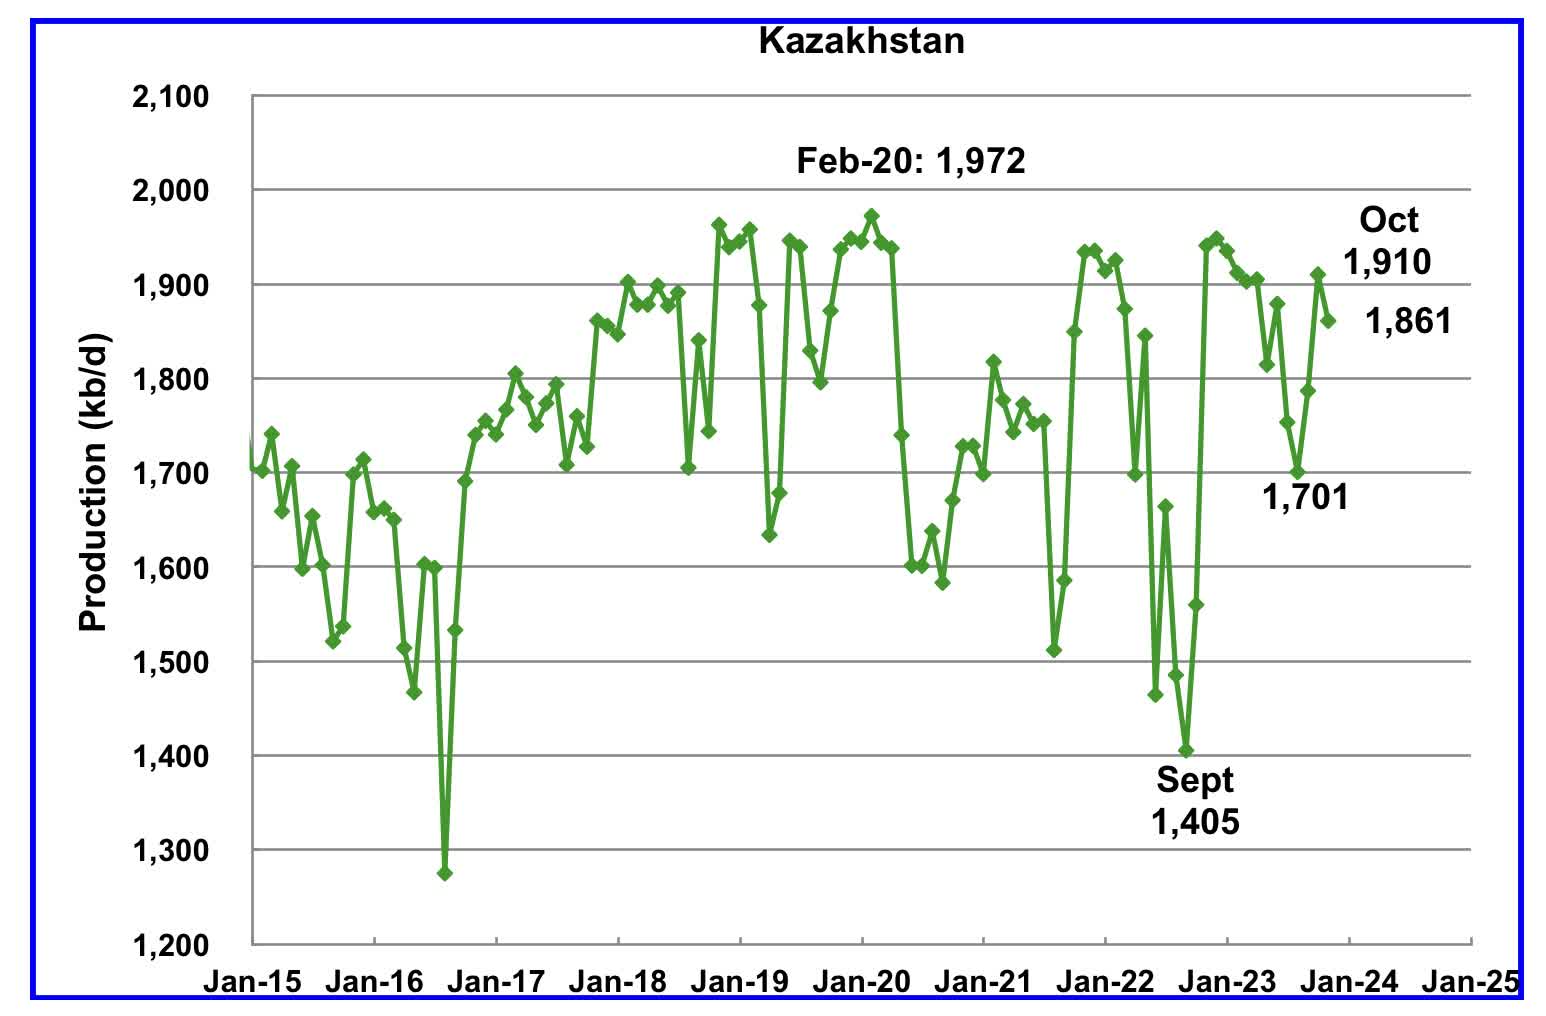
According to the EIA, Kazakhstan’s output decreased by 49 kb/d in November to 1,861 kb/d.
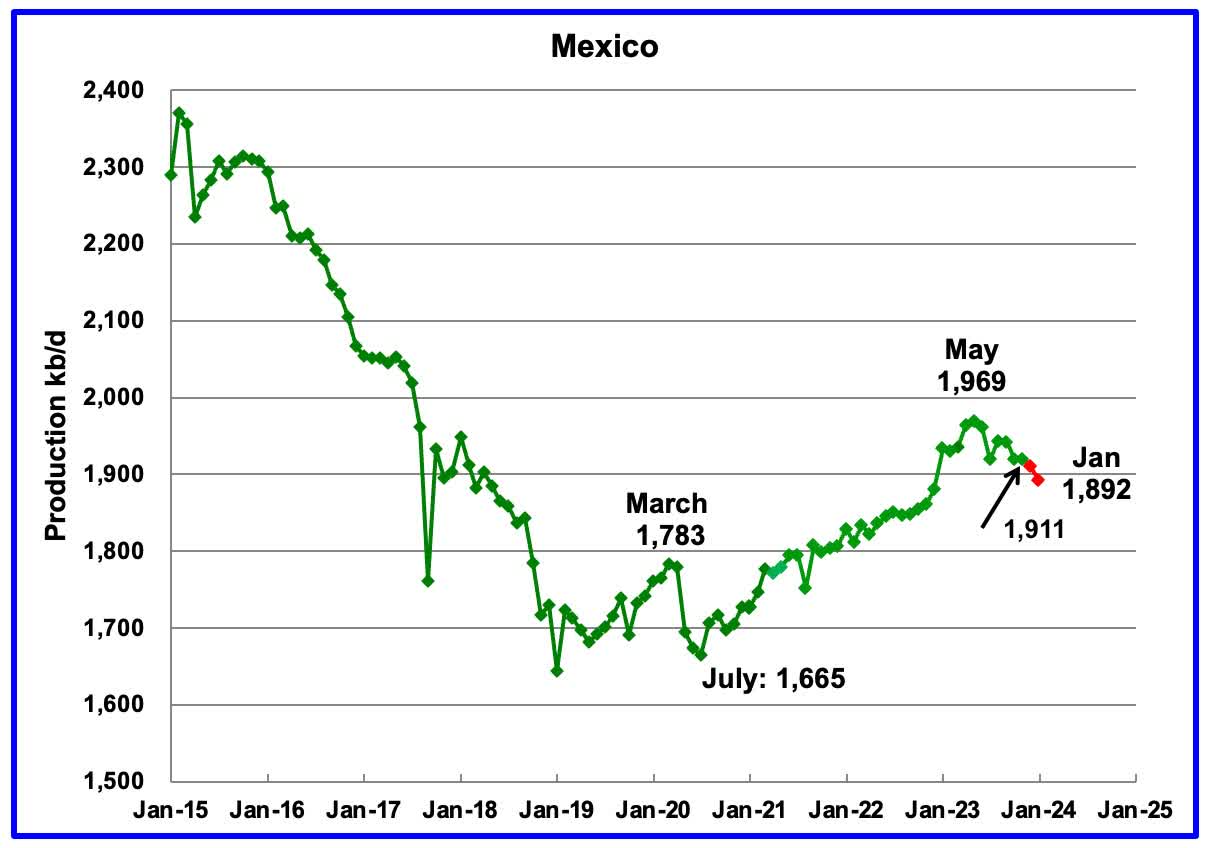
According to the EIA, Mexico’s output decreased by 7 kb/d in November to 1,911 kb/d.
According to Pemex, Mexico’s oil production dropped in December and January to 1,892 kb/d.
Mexico has recently revised its definition of condensate. This has resulted in the EIA adding an extra 60 kb/d, on average, to the Pemex report. The red markers include an additional 60 kb/d.
According to the March 2024 MOMR: “Mexico’s liquids production is forecast to drop by 60 tb/d to average 2.0 mb/d in 2025. Production ramp-ups in projects like Mezcalapa, Amoca-Yaxche, Okom, Tucoo-Xaxamani and Amoca-Mizton-Tecoalli are expected to be more than offset by declines in several fields such as Quesqui and Tupilco Profundo. Meanwhile, output in the Ku-Maloob-Zaap asset is expected to remain stable.
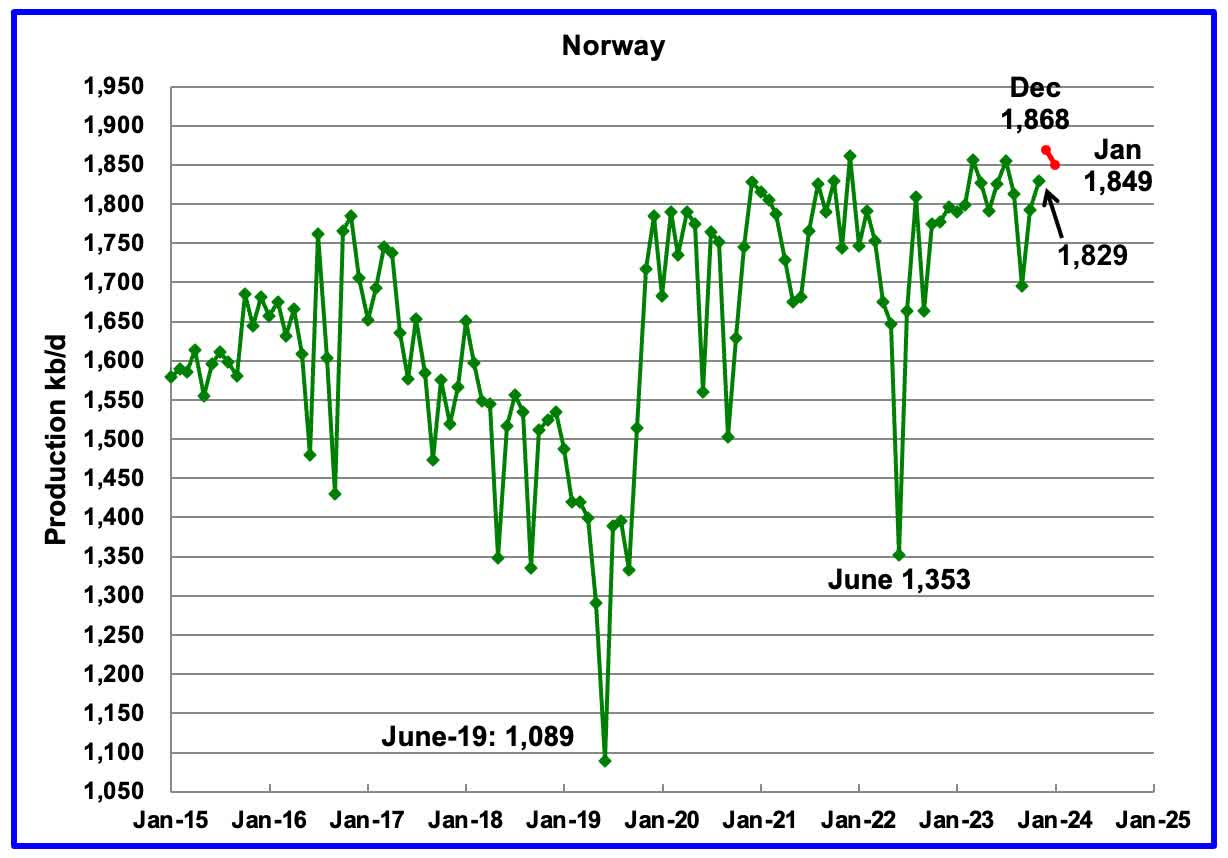
The EIA reported Norway’s November production increased 36 kb/d to 1,829 kb/d.
Separately, the Norway Petroleum Directorate (NPD) reported that December’s production added 39 kb/d to 1,868 kb/d, a new post pandemic high, red markers. January dropped to 1,849 kb/d.
According to the NPD: “Oil production in January was 1.9 percent higher than the Norwegian Offshore Directorate’s forecast.”
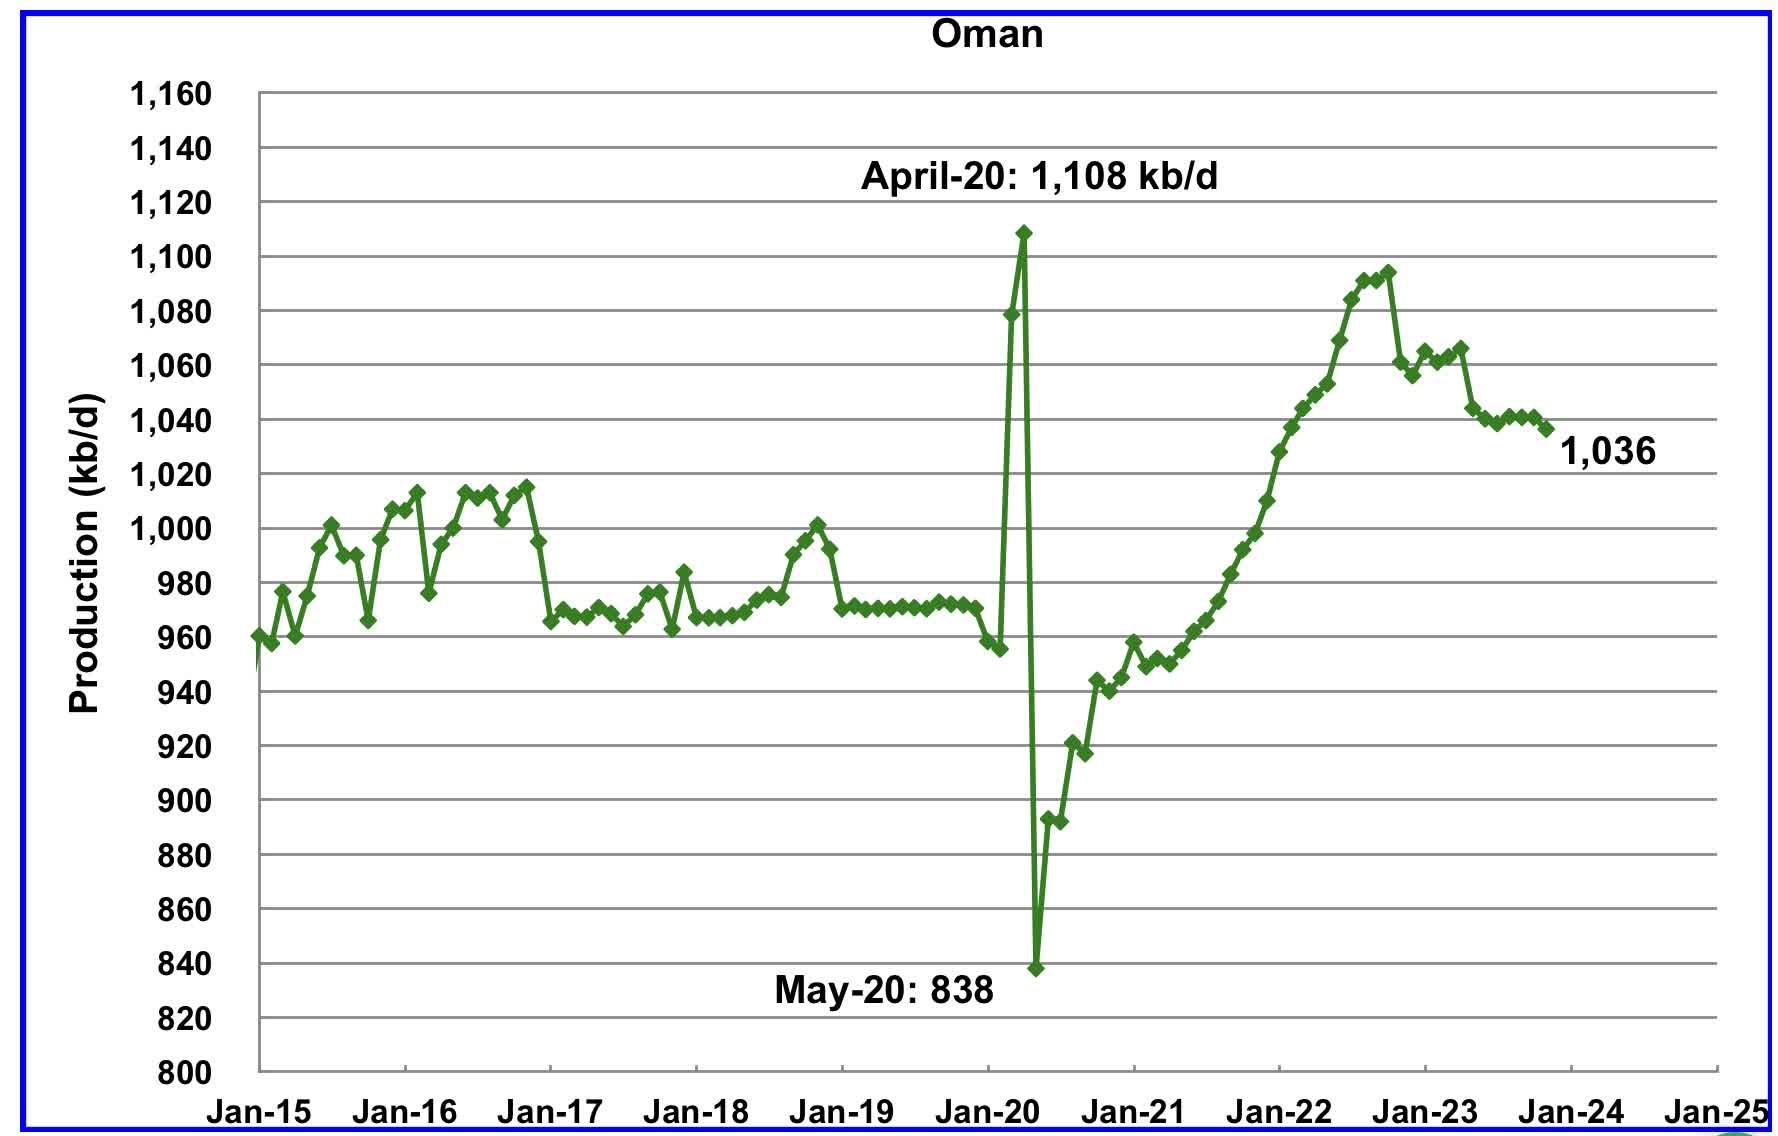
Oman’s production has risen very consistently since the low of May 2020. However, production began to drop in November 2022. According to the EIA, November 2024 output was 1,036 kb/d.
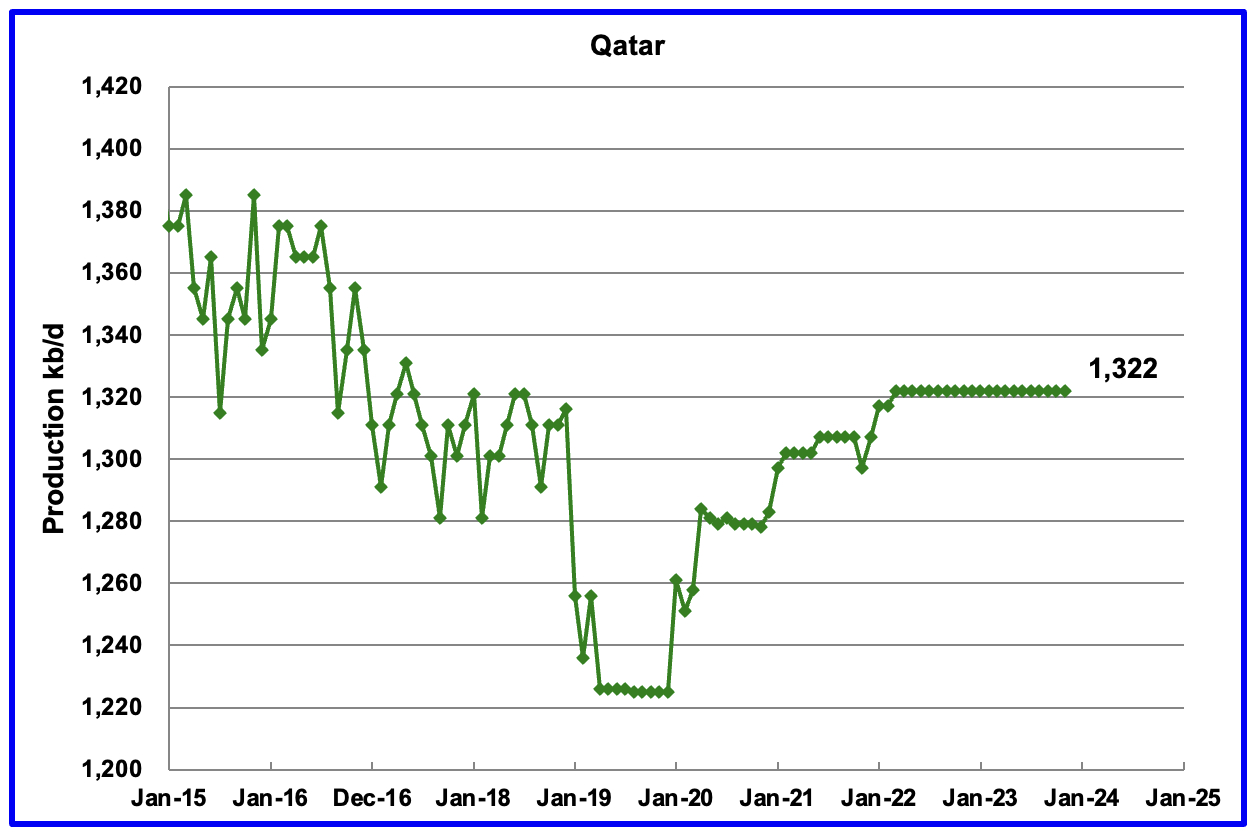
Qatar’s November output was unchanged at 1,322 kb/d, possibly due to lack of updated information.
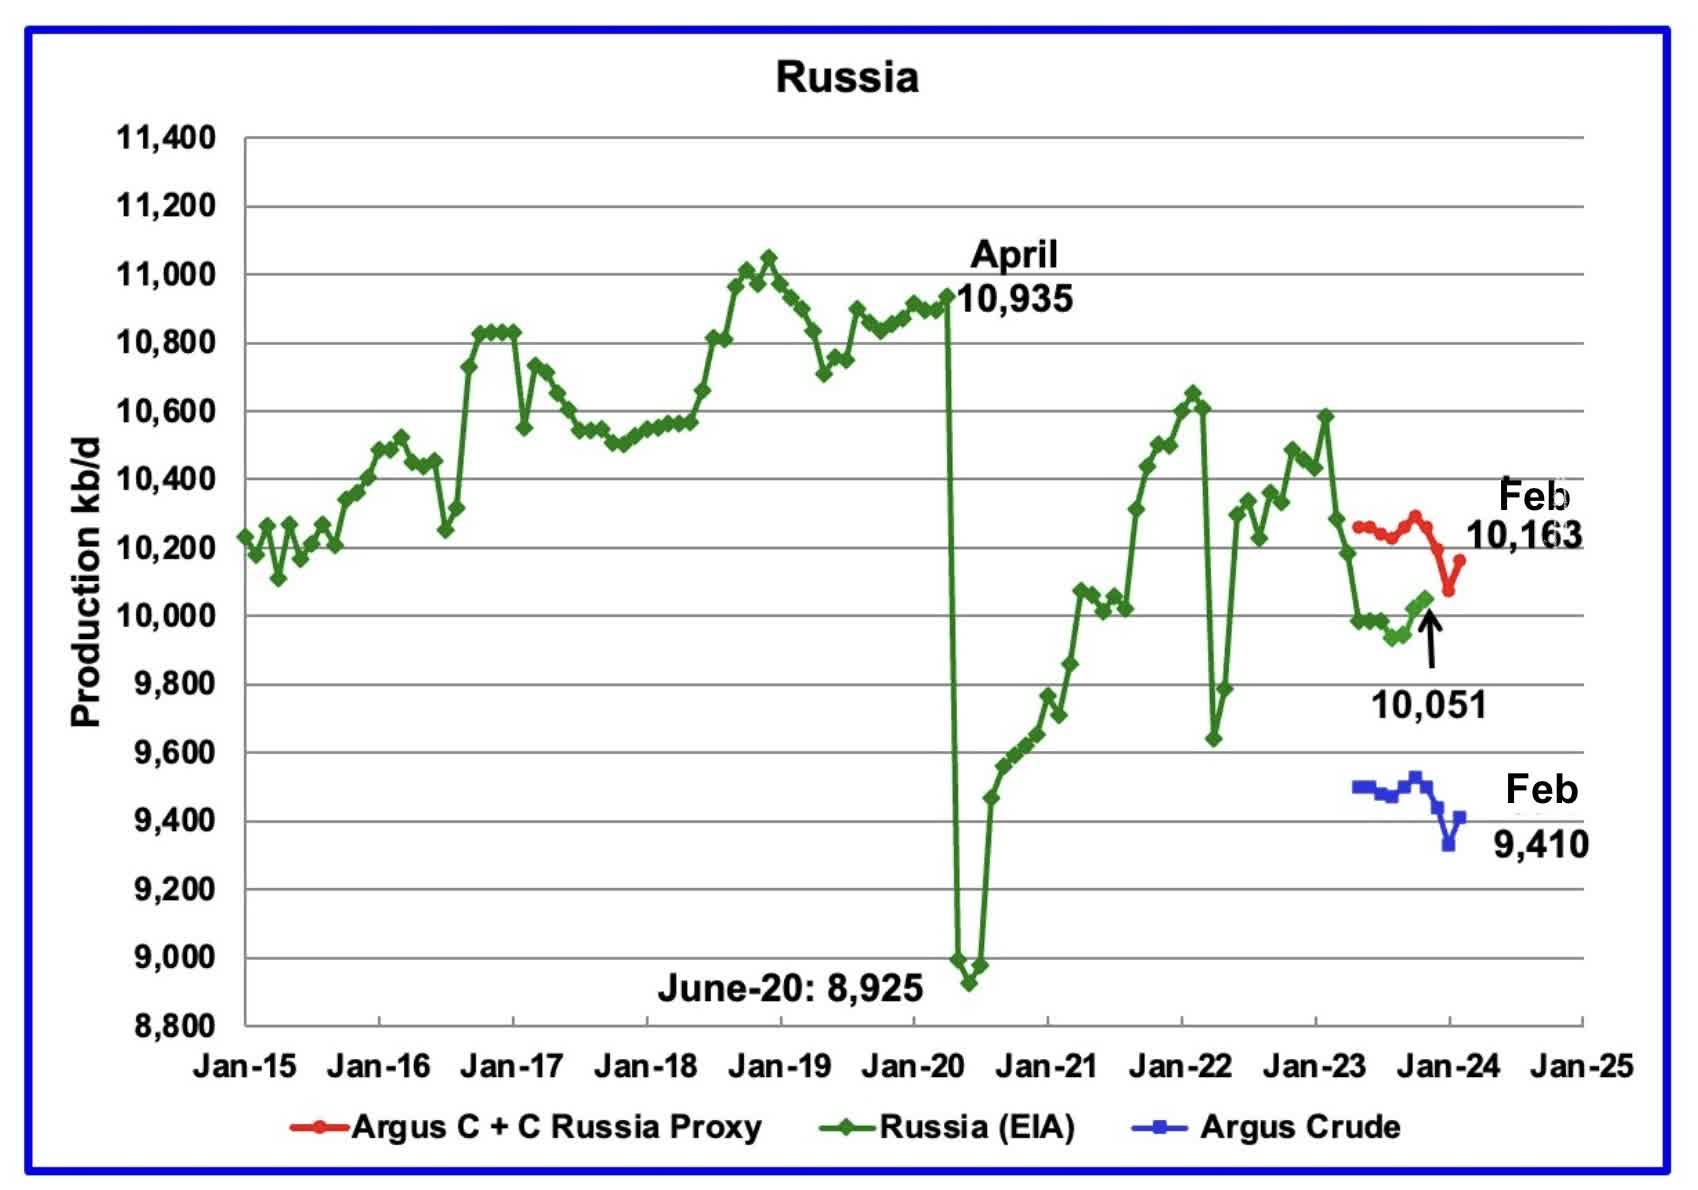
The EIA reported Russia’s November C + C production rose by 30 kb/d to 10,051 kb/d. Using data from the March STEO report, Russian output is expected to be slightly higher at 10,076 kb/d in January 2024.
Using data from Argus Media reports, Russian crude production is shown from May 2023 to February 2024. For February 2024, Argus reported that Russian crude production was 9,410 kb/d, an increase of 80 kb/d, blue markers. Adding 8% to Argus’ February crude production provides a C + C production estimate of 10,163 kb/d, which is a proxy for the Pre-War Russian Ministry estimate, red markers. S&P Platts reports that Russian February crude production was 9,430 kb/d, up 10 kb/d from January, reasonably close to the Argus estimate.
If the EIA’s Russian production projection is correct, this indicates that there is no sign that Western sanctions are affecting their oil production at this time. The Argus and EIA trends are going in opposite directions in the September to November time frame. However, Argus’ source may be catching up as it indicates increased production in February.
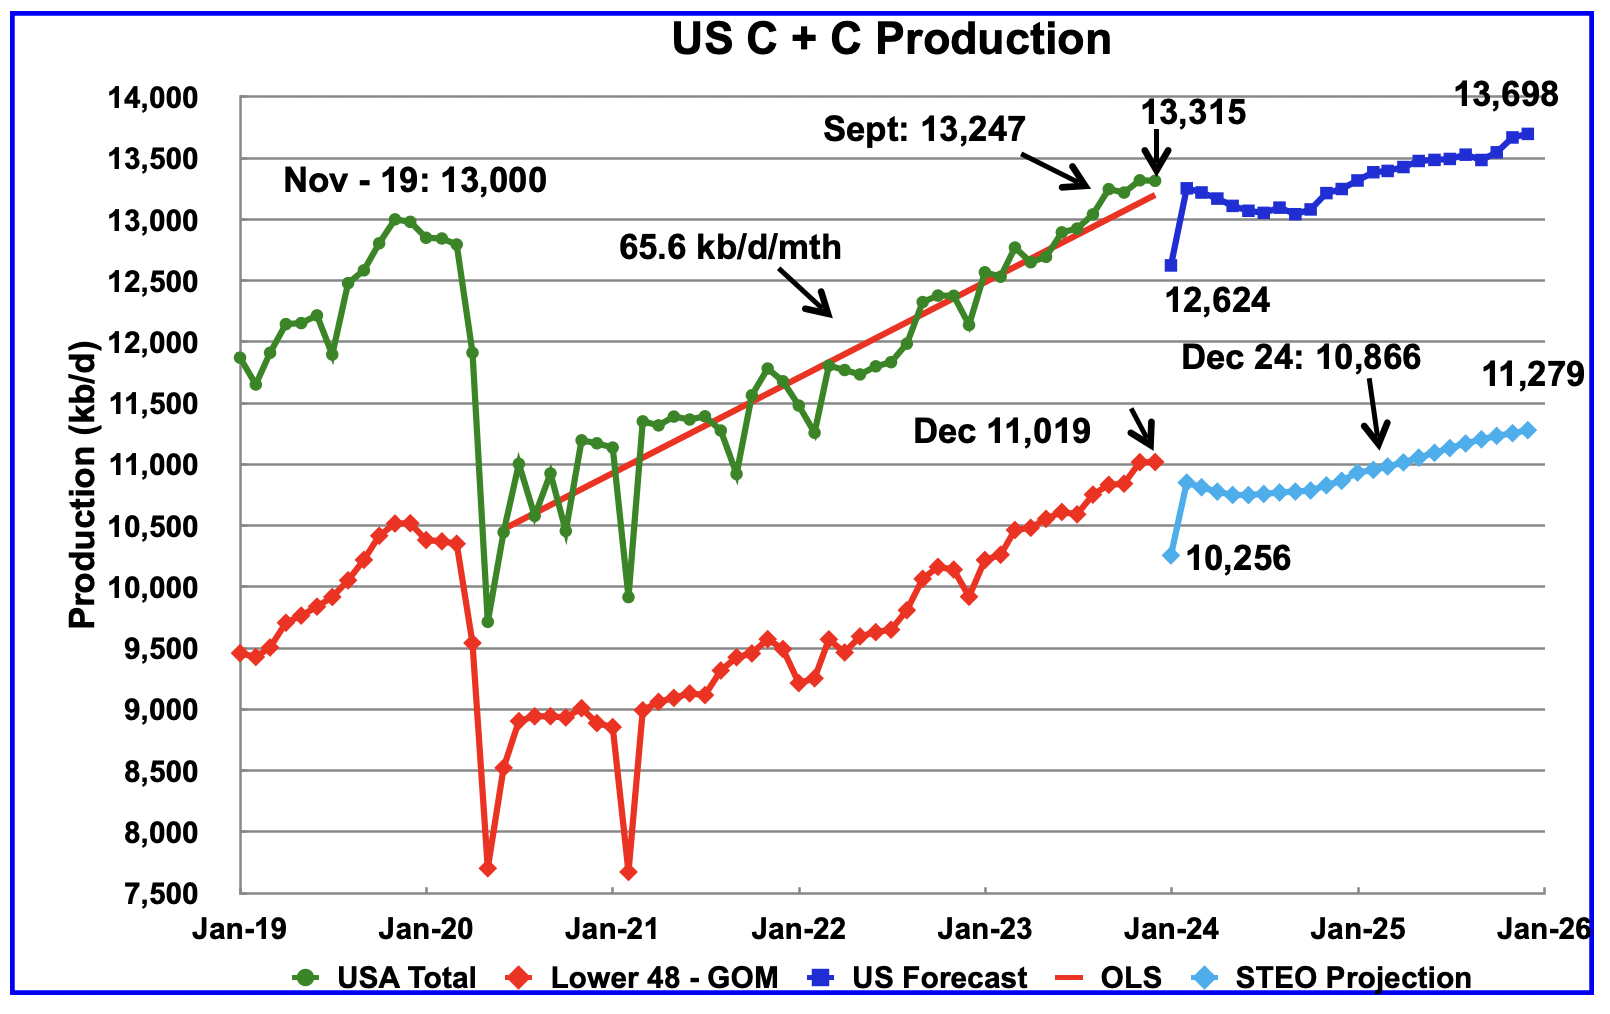
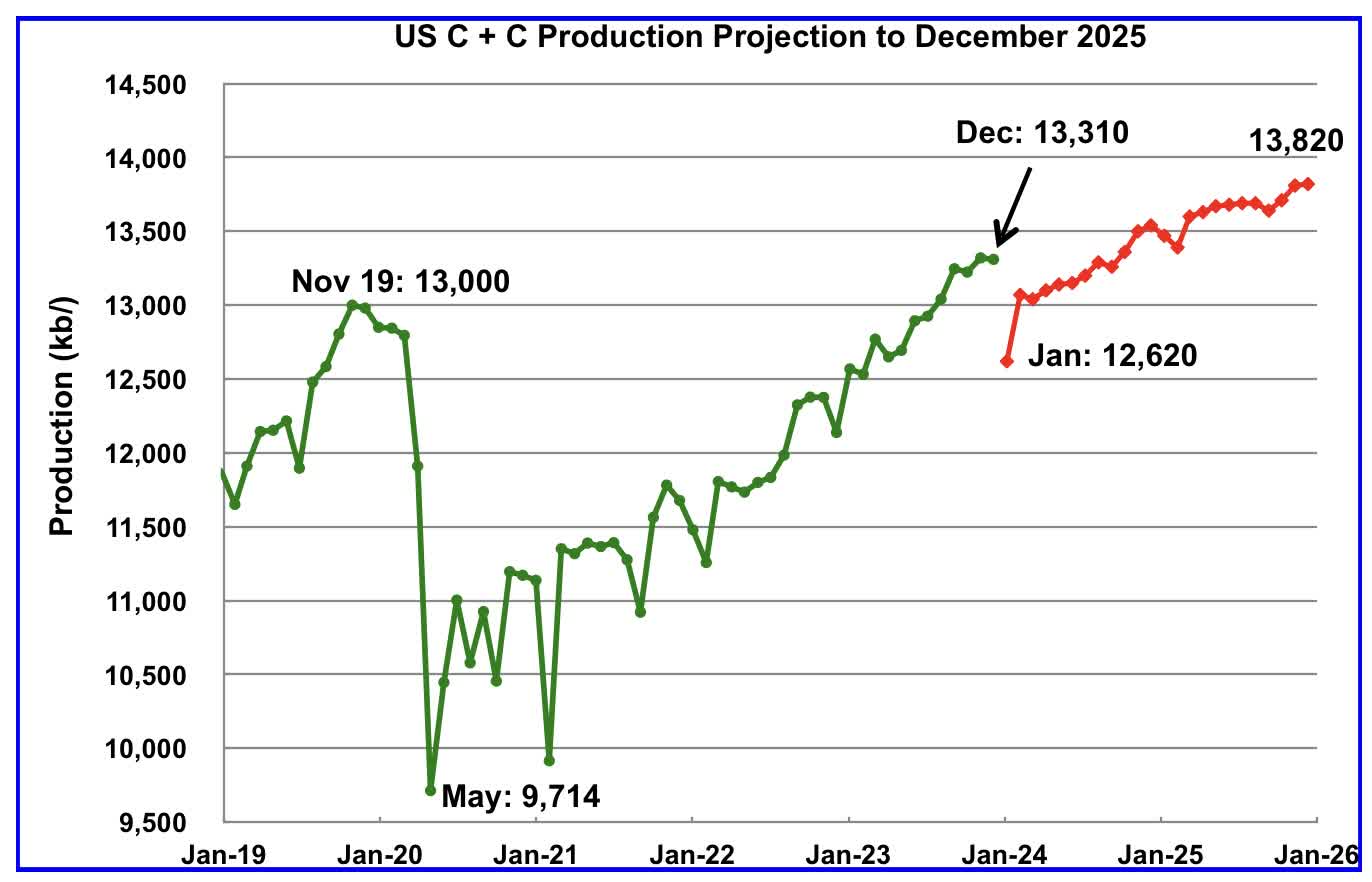
According to the updated March STEO, US oil output dropped by 10 kb/d in December to 13,310 kb/d. US January oil production is projected to decrease by 690 kb/d to 12,620 kb/d due to severe weather in the central US.
The US production projection in the lower chart, red graph, has been updated using the March STEO. The upper chart was posted in the December US update and is reposted here to show how the projection to 2025 has changed, primarily the 2024 portion.
Is the big production drop in the first six months of 2024, excluding January, due to the lack of new well startups during that bad weather week along with the high decline rates associated with the currently producing wells?
Editor’s Note: The summary bullets for this article were chosen by Seeking Alpha editors.
[ad_2]
Source link –
